

TSLA – Post-April Rally Could Be a Correction: Trend Test or $295 Pullback Ahead?
📉 Asset:
Tesla Inc. (TSLA)
🎯 Direction:
Neutral-to-bearish short term
✅ Target Zone:
$295.00 – trend break support
$420.00 – bullish gap breakout potential
📍 Current Status:
5-wave rally under question; structure may be corrective
🔎 Replay and TradingView chart:
🧠 Quick Analysis Summary:
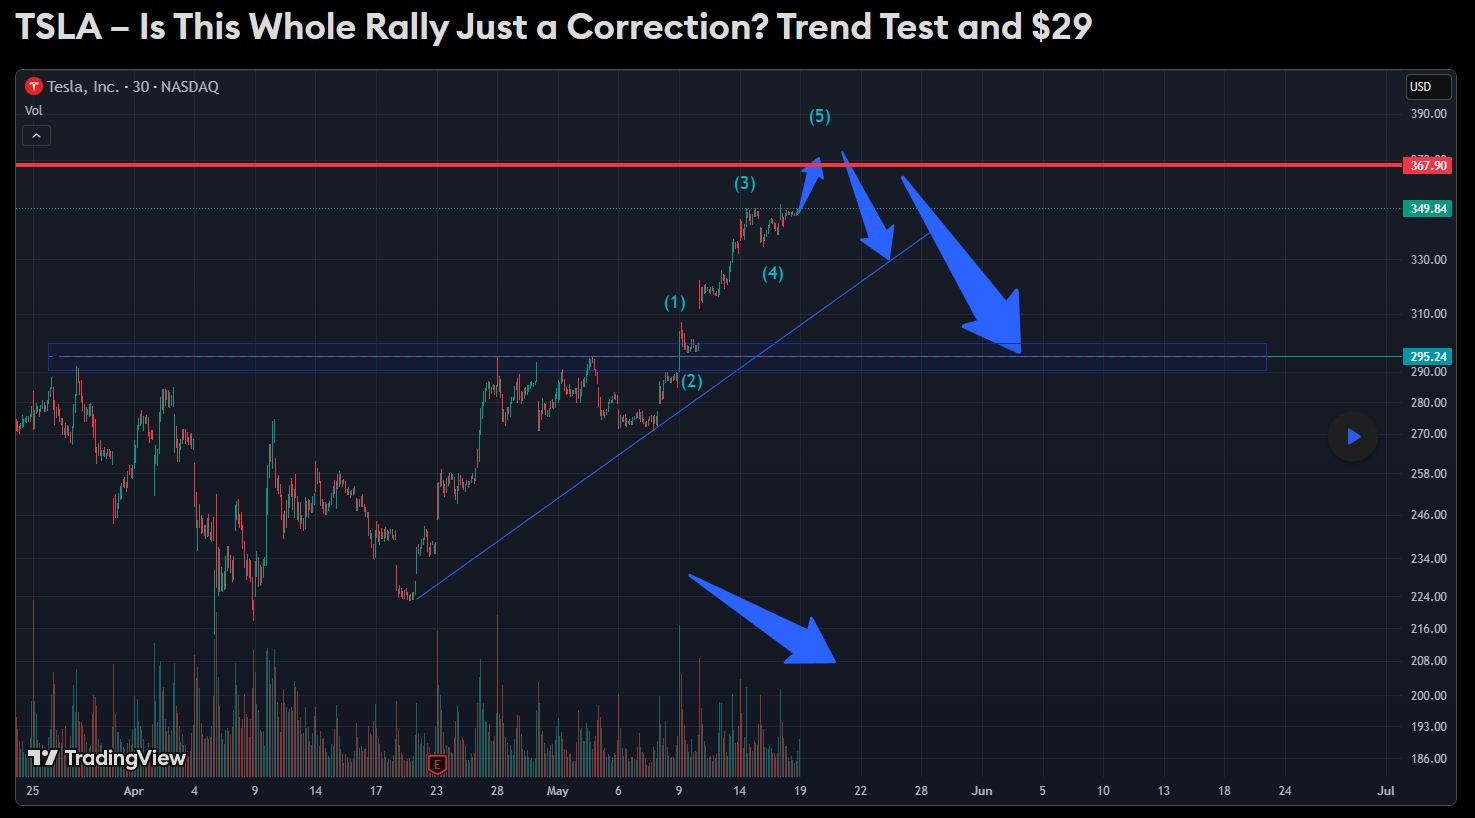
The recent uptrend in Tesla stock (TSLA), starting from the April 7th low, may appear impulsive but could actually be part of a corrective wave structure. Corrective waves are notoriously deceptive, often giving the illusion of trend strength while merely forming patterns such as zigzags, flats, or complex corrections.
One key factor to monitor is the 367.90 resistance. If Monday opens with a gap-up breakout above this level — ideally on strong volume — the price might extend toward the psychological resistance of $420. However, this scenario heavily depends on the strength of the opening session.
📉 Bearish Alternative – Watch for Weakness:
If the week starts with weak volume, a trendline retest could be imminent. The ascending support formed throughout May has been guiding the rally. Losing this structure may shift the sentiment quickly.
A confirmed breakdown below the trendline could trigger a pullback toward $295, which aligns with previous resistance-turned-support and high-volume node activity on the chart.
📈 Scenario Breakdown:
- Structure: 5-wave rally possibly part of a correction
- Resistance: $367.90 — must break with volume
- Upside Risk: $420 potential on breakout
- Support Trendline: Watch for test and failure
- Downside Risk: $295 target on trendline break
🔍 Technical Keywords for Traders:
- Elliott Wave Correction
- Breakout Confirmation
- Trendline Retest
- Support Flip
- Volume-Based Reversal
- Tesla Stock Forecast
- NASDAQ Price Action
- Gap Trading Setup
📌 Conclusion:
Tesla’s current structure leaves both paths open — bullish breakout or bearish retracement. But the lack of strong Monday volume, especially after a gap-up, could act as a trap. $367 is key to unlock upside toward $420. Failure there and a loss of the rising trendline opens the door to $295.
Until then, monitor price structure and volume dynamics closely.