

SUI/USDT – Final Impulse or Breakdown? Two Scenarios in Play
📅 Original Forecast Date: May 17, 2025
📉 Asset: SUI/USDT
🎯 Projected Move: Final push in wave (5) or breakdown from diagonal
✅ Target Area: $2.93 support zone
📍 Status: In Progress
🔎 Replay & Chart:
▶️ Click the image below to view full chart on TradingView.
🧠 Analysis Summary:
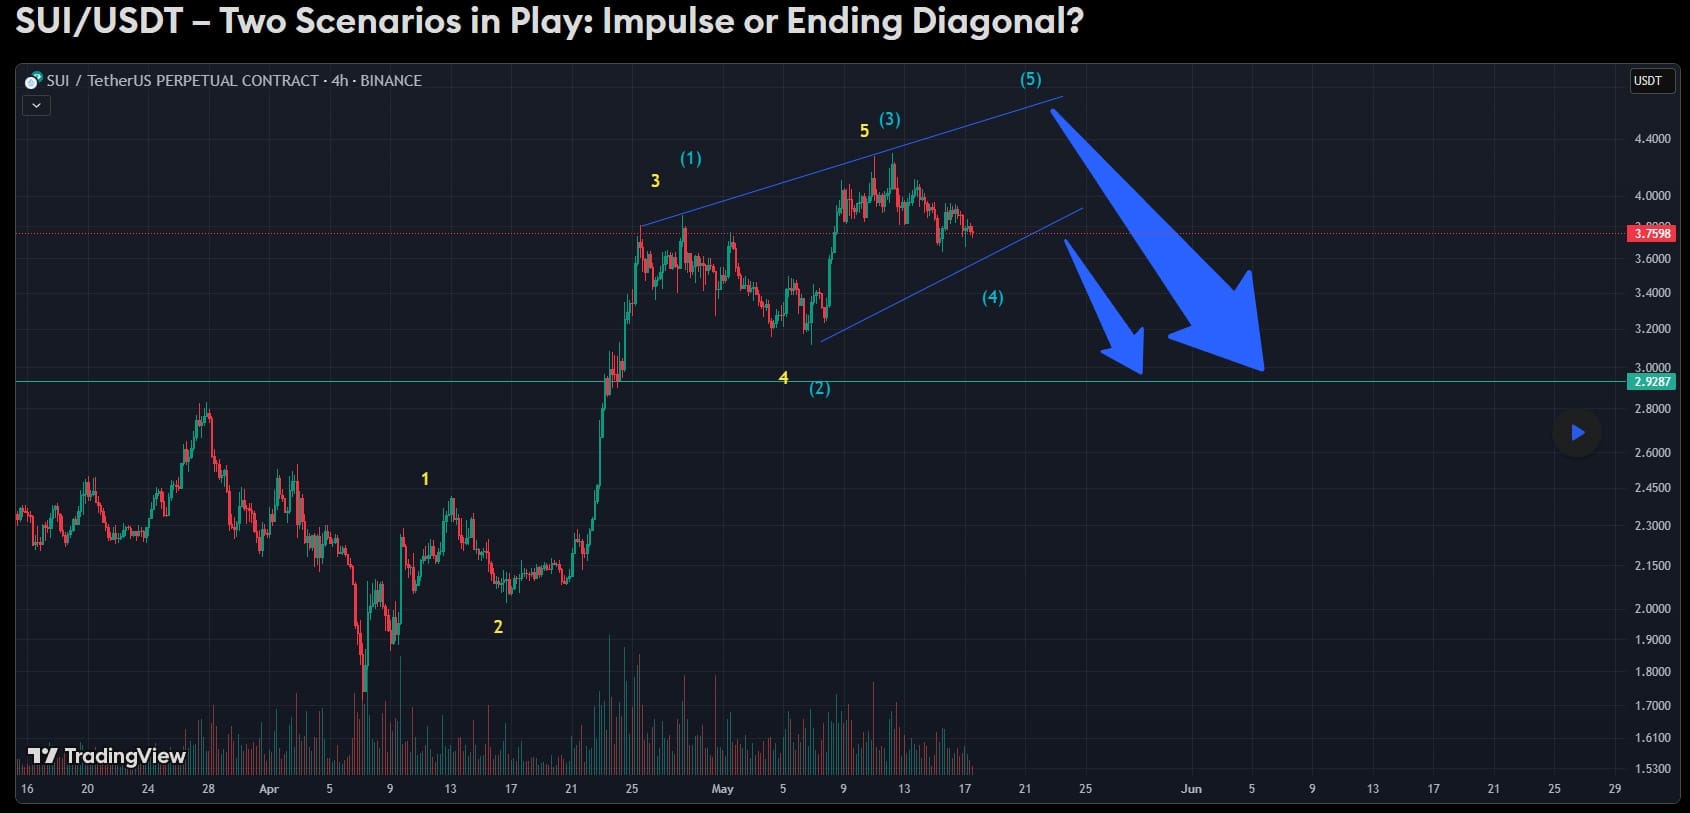
On May 17, 2025, SUI was analyzed for a possible ending diagonal or continuing impulse wave (5).
The price structure shows contracting wedge formation—typically either a terminal pattern or a continuation phase.
Scenario 1: A bullish breakout could finalize wave (5).
Scenario 2: A bearish breakdown may drag price to $2.93, wave (2)’s base.
Volume and wedge breakout will likely decide direction.
📈 Outcome:
📊 Currently testing wedge support.
🚨 A confirmed move will validate one of the two scenarios.
📌 For replay-verified trades and high-accuracy setups:
cakirinsights.com