HSBC Holdings (HSBC) – Potential ABC Correction Watch as $54 Looms
📉 Asset HSBC Holdings, plc. (NYSE: HSBC)
🎯 Price Direction Rising within short-term wedge, but vulnerable to correction
✅ Potential Target Zone ~$54 support area, aligned with prior structure
📍 Current Market Setup HSBC is rising but may be entering the final phase of a corrective wave structure (ABC). A ~5% drop could initiate a full correction.
🔎 Replay & Chart Access
Click to view live chart.
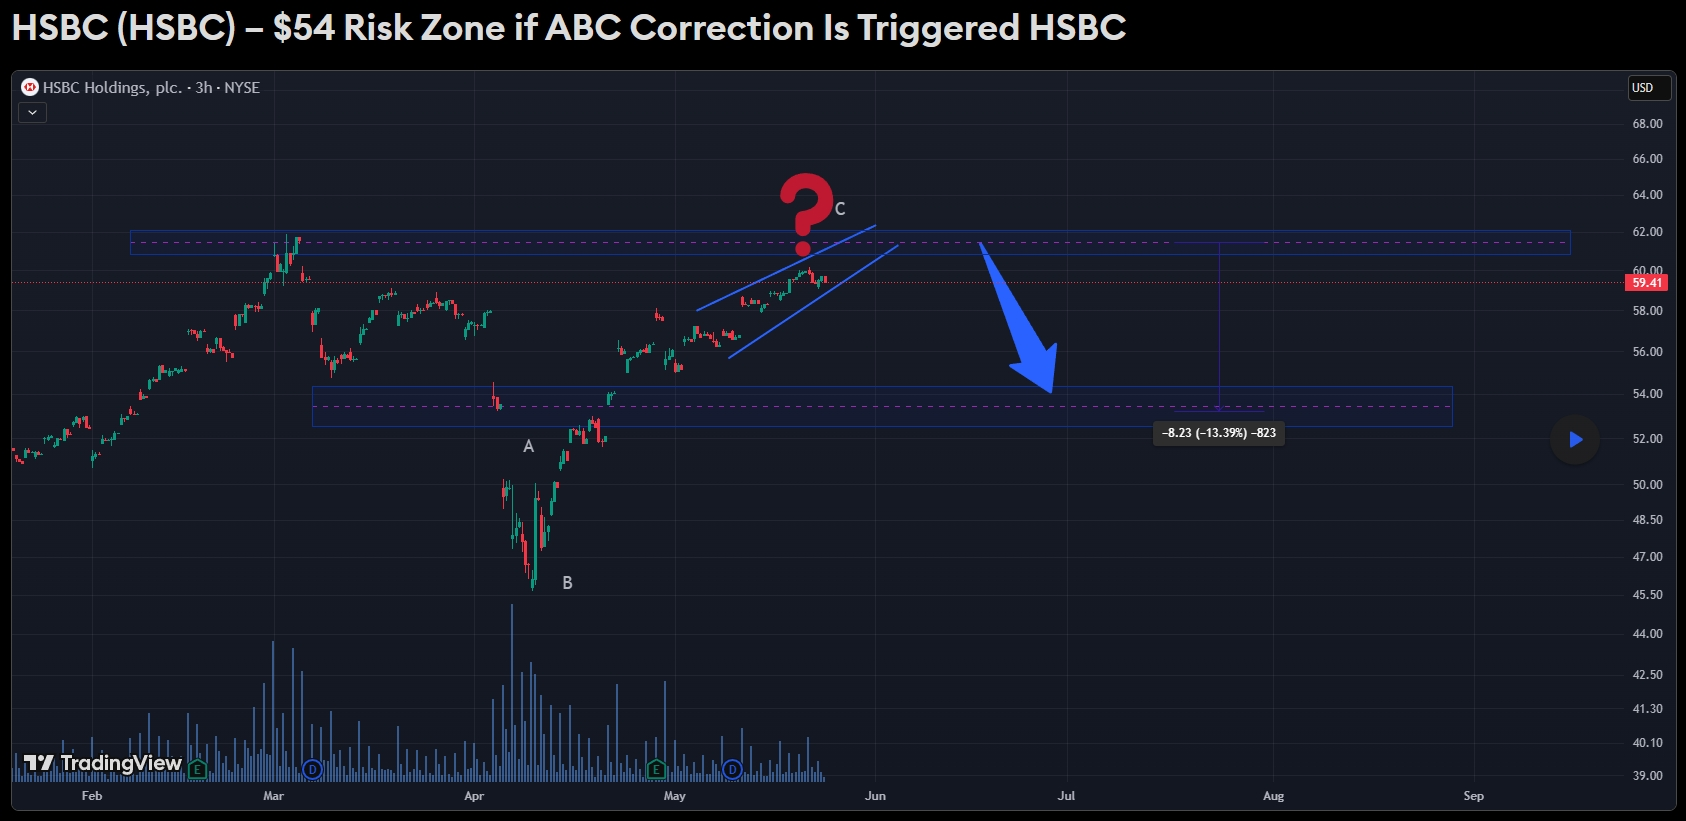
🧠 Analysis Summary HSBC is currently trading inside a narrow rising wedge following a sharp recovery. The price action so far has the characteristics of a developing ABC corrective pattern. Wave A and B are clearly visible, and price is now within what may be a terminating C wave.
Although the chart remains technically positive and no clear bearish breakdown has occurred, structural risk is building. A 5% downward move from current levels would be sufficient to trigger the start of wave C.
Such a move could change the market context significantly and target the $54 region—where a prior accumulation and breakout structure aligns. This area is also consistent with Fibonacci retracement levels and would represent a 13% decline from the local peak.
Importantly, this is not a bearish forecast, but a structural warning. Elliott Wave analysis does not predict direction—it identifies possible wave formations and conditions for activation.
If the market continues higher without rejecting this rising wedge, the corrective setup is invalidated. But if the price slips even modestly, it could spiral into a deeper retracement phase.
This is a scenario-driven outlook. Traders should treat the 5% decline threshold as a pivot level for monitoring. A break of that zone would shift sentiment quickly and target $54 as the most likely resolution area.
📈 Conclusion
- HSBC trades in a rising wedge
- ABC correction is unconfirmed, but a 5% drop could trigger it
- If triggered, target lies near $54
- Structure must be monitored closely in coming sessions