
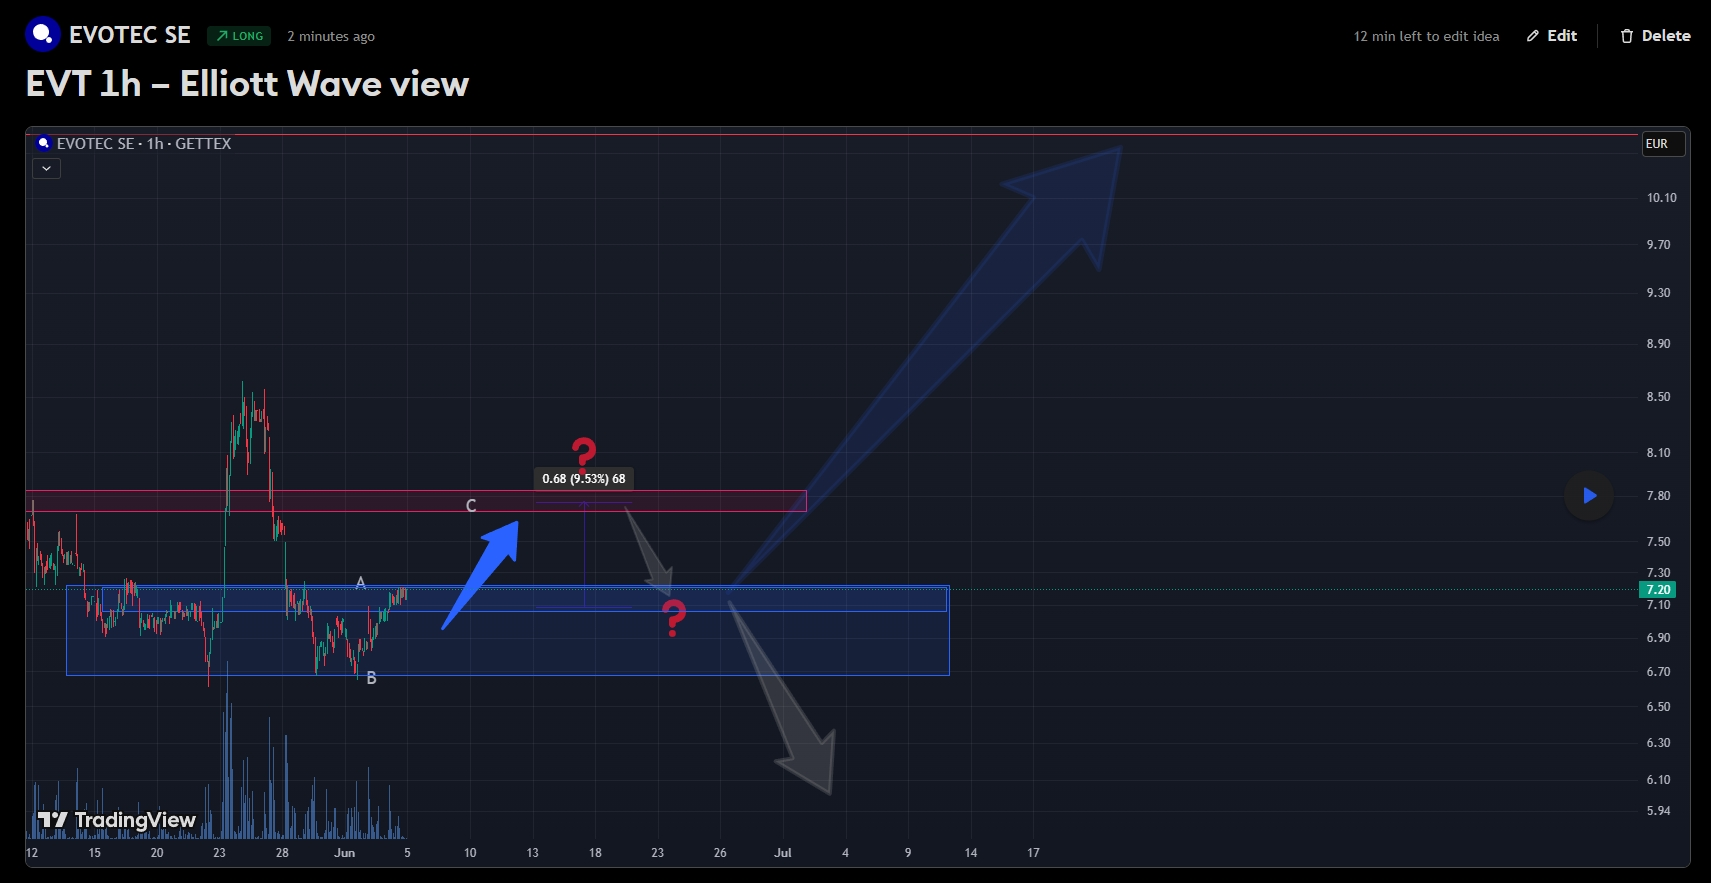
Evotec SE (EVT) – Corrective Zigzag Targets 7.80 EUR
📅 Timeframe
1-Hour
📉 Asset
Evotec SE (GETTEX: EVT)
🎯 Direction
Corrective rally within a broader decline
✅ Target Zone
7.70 – 7.80 EUR (extension to 11.00 EUR only if broken)
📍 Current Status
Wave C advancing toward supply
🔎 Chart & Replay
Click to open live replay on TradingView.
🧠 Short Analysis Summary
The plunge from 8.50 EUR carved a textbook five-wave impulse that bottomed at 6.50 EUR. Price action since then is unfolding as an A-B-C zigzag:
- Wave A – swift thrust from 6.70 EUR to 7.20 EUR.
- Wave B – deep, time-consuming pull-back to 6.90 EUR.
- Wave C – now lifting price toward 7.70 – 7.80 EUR.
Volume and momentum lag the rally, supporting the corrective reading. Until 7.80 EUR is conquered decisively, the move is viewed as a counter-trend bounce.
Detailed Breakdown
1. Demand – the Blue Box (7.05 – 7.25 EUR)
This pocket coincides with the lower edge of a prior range, a high-volume node, and the 38 % retrace of Wave A. Each visit has produced spring-type candles, confirming active bids. Long setups favor entries here with stops below 6.90 EUR.
2. Supply – the Red Box (7.70 – 7.80 EUR)
Here lie three overlapping barriers:
- underside of a broken consolidation base,
- 61.8 % Fibonacci retrace of the 8.50 → 6.50 EUR sell-off,
- upper rail of a corrective channel.
Wave C statistically ends near this Fib cluster, making the zone ideal for profit-taking or fresh shorts.
3. Two Likely Paths
Fast Resolution – Price punches straight into 7.80 EUR, prints exhaustion candles, then rolls back to 7.20 / 6.90 EUR as a larger decline resumes.
Time Burn – Price first drifts sideways inside the blue range, builds an expanded flat, then makes one final spike into supply before reversing. Same destination, slower clock.
4. Invalidation & Alternate Scenario
The corrective thesis fails only if price rallies through 7.80 EUR in a clear five-wave sequence and retests the area as support. Such strength would open a path toward the origin of the sell-off near 11.00 EUR and challenge the falling trend line that has capped rallies for months.
📈 Result Summary
Bulls have the micro-trend while 7.05 EUR holds, but the rally’s corrective signature warns of limited lifespan. A stall inside 7.70 – 7.80 EUR should usher in a return to the blue demand band. Aggressive longs trail stops under 7.05 EUR; counter-trend traders watch supply for bearish reversal triggers with risk capped above 7.95 EUR.
Closing: cakirinsights.com