

BTCUSDT – Large Diagonal in Progress? Wave B May Drag Bitcoin to $91K - $92K Before New ATH
📉 Asset:
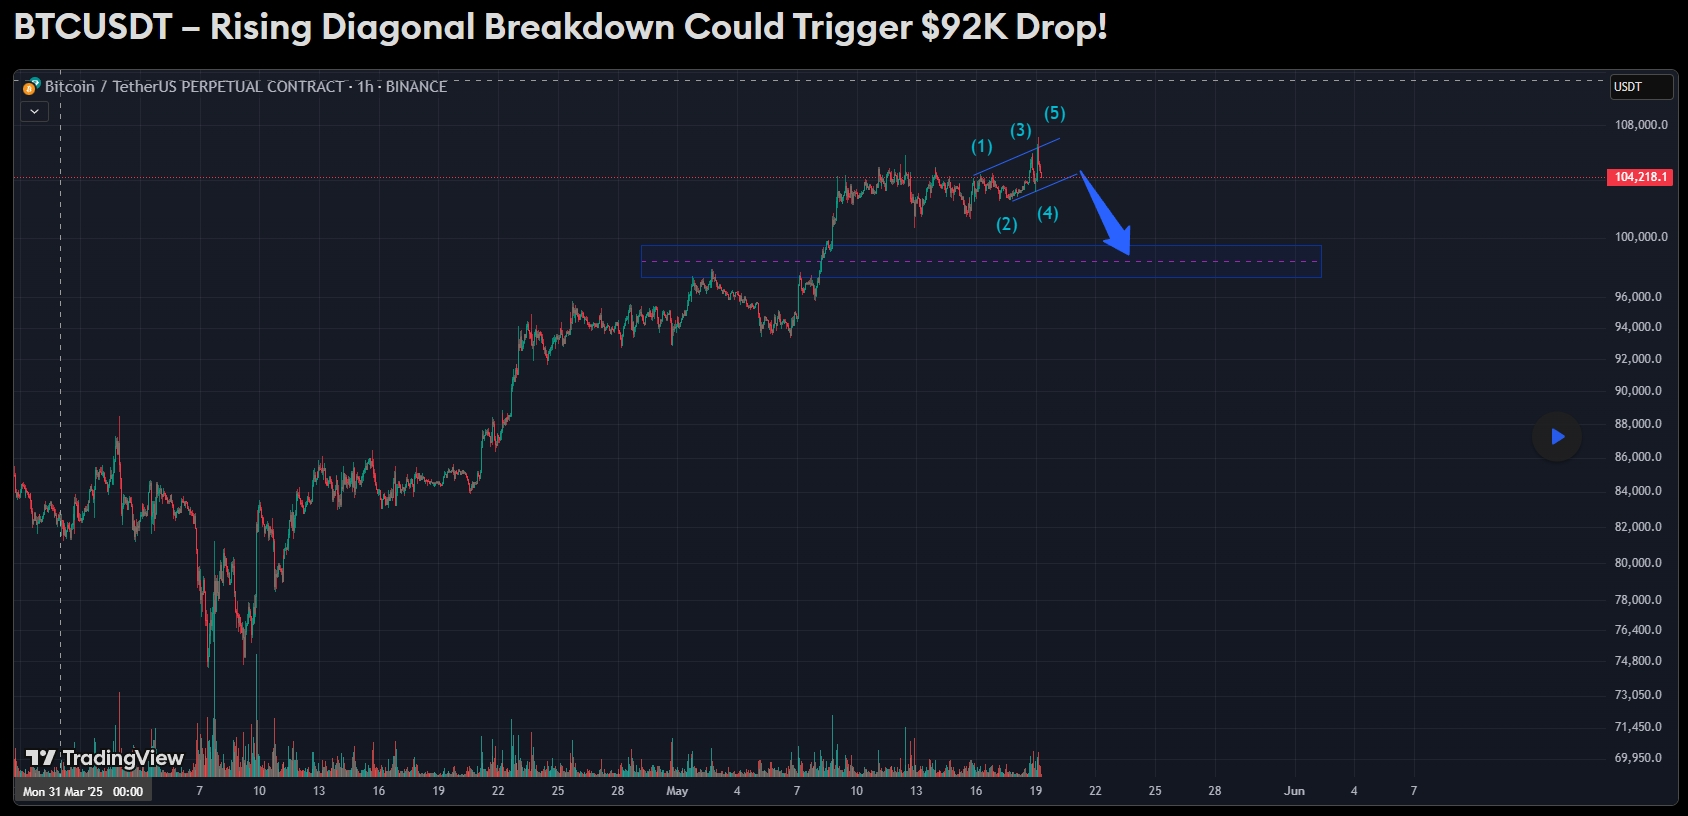
Bitcoin (BTCUSDT)
🎯 Direction:
Short-term bearish, mid-term bullish
✅ Target Zone:
$91,000 – $92,000 (Wave B)
Potential ATH (Wave C)
📍 Current Status:
Possible completion of Wave A inside a diagonal structure
🔎 Replay and TradingView link:
🧠 Quick Analysis Summary:
BTCUSDT may be developing a large diagonal pattern that started at $75K. The entire structure resembles an A-B-C diagonal, where the market is likely completing Wave A.
Diagonal patterns often signal larger trend transitions. If this is truly Wave A, we could see a corrective Wave B pulling the price down to the $91K–$92K region. This zone aligns with high-volume demand and historical support.
Following this corrective leg, Wave C may initiate a bullish breakout — potentially targeting a new all-time high (ATH).
📈 Scenario Overview:
- Wave A may be complete or nearing completion
- A pullback to $91K–$92K would fit a classic B wave
- If confirmed, a C wave breakout may follow
- Diagonals often form with increased volatility and overlapping price action
- This structure creates both short-term sell and mid-term buy opportunities
🔍 Technical Insights:
- The impulsive leg from $75K shows 5-wave characteristics
- Recent price action fits a possible ending diagonal
- $98K support is key — losing it could confirm Wave B
- $91K is a logical target based on both technicals and liquidity
- Bullish bias resumes after B wave ends
🔎 Why It Matters:
This structure reflects a broader market setup, combining short-term correction with long-term bullish potential. For traders and investors, recognizing a diagonal early can offer edge for both trend continuation and reversal plays.
The upcoming weeks may offer pivotal entry zones with high reward/risk setups for swing strategies.