

BTAI – Oversold Bounce or Trend Reversal? $1.60 Resistance in Focus
📅 Forecast Date: May 19, 2025
📉 Asset: BioXcel Therapeutics Inc. (BTAI)
🎯 Direction: Bullish bounce attempt
✅ Target Area: 1.60 resistance zone
📍 Current Price: 1.42
🔎 Replay & TradingView Link:
🧠 Analysis Summary:
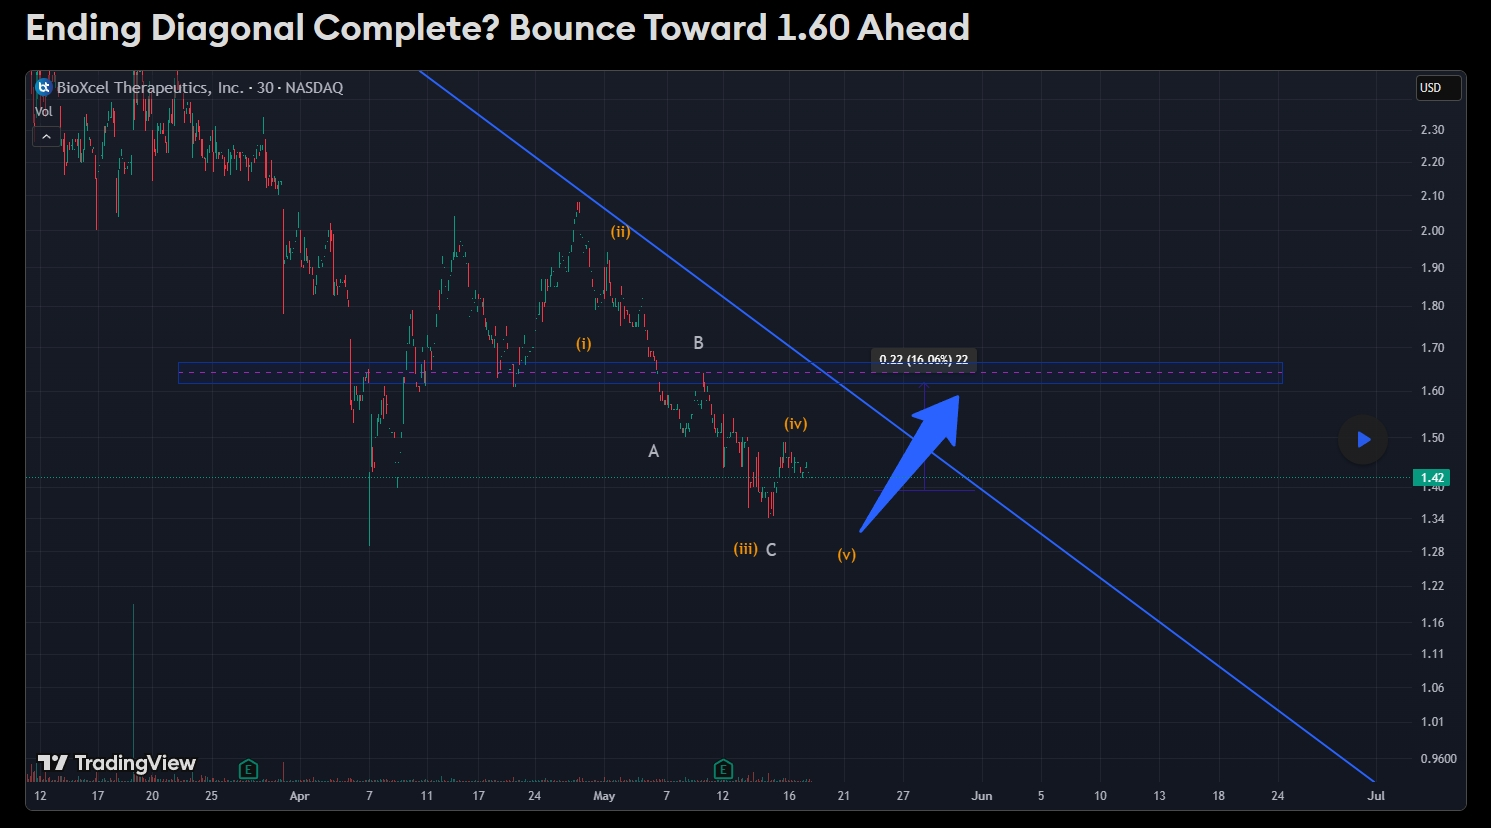
BTAI appears to have completed a classic five-wave decline followed by an ABC correction, bottoming around $1.35. The final leg of wave (v) seems complete, suggesting a potential short-term bullish move. The price has started to react from oversold territory, targeting the previous breakdown level near $1.60, which also coincides with a descending trendline resistance.
📈 Result Summary:
A potential 16% move toward the $1.60 zone is in play. This area will be critical: a breakout could lead to further recovery, while a rejection may resume the downtrend.
cakirinsights.comTitle: BTAI – Oversold Bounce or Trend Reversal? $1.60 Resistance in Focus
📅 Forecast Date: May 19, 2025
📉 Asset: BioXcel Therapeutics Inc. (BTAI)
🎯 Direction: Bullish corrective bounce
✅ Target Area: $1.60 resistance zone
📍 Current Price: $1.42
🔎 Replay & TradingView Link:
🧠 Short Analysis Summary:
BTAI appears to have completed a five-wave Elliott decline with a confirmed ABC corrective structure. Price is reacting strongly from a support base near $1.35, potentially targeting the $1.60 resistance level aligned with a major descending trendline.
📈 Full Technical Breakdown:
BioXcel Therapeutics Inc. (BTAI) has experienced a prolonged downtrend, showing a textbook Elliott wave 5-wave structure downward followed by a corrective ABC pattern. The decline found strong support near $1.35, and the current price action suggests a possible technical bounce toward $1.60.
Wave (v) seems complete, and early signs of reversal are seen as price reacts upward. The $1.60 area is a high-probability resistance level — it matches a prior support zone and intersects a long-standing descending trendline. If this area is broken with volume confirmation, the move could extend further, potentially toward the $1.75–$1.80 range.
However, this bounce is still within the context of a larger bearish setup. A rejection from $1.60 would likely signal the end of the corrective rally and a resumption of the downtrend. Historical behavior of BTAI includes several such bounces of 15–20% magnitude, usually met with heavy selling at key levels.
Indicators such as RSI and MACD are recovering from oversold territory, though confirmation of a trend reversal remains pending. Volume is increasing slightly but has not yet crossed threshold levels to suggest aggressive accumulation.
If this move sustains above $1.60 with follow-through, it may validate the end of the wave structure and open a new bullish leg. Otherwise, another retest of $1.35 or even lower levels remains a threat.
Key Observations:
- Wave (v) appears complete at $1.35
- Bounce underway targeting $1.60 (potential +16%)
- $1.60 = prior support + descending trendline
- RSI and MACD reversing, volume improving
- Breakout = short-term bullish continuation
- Rejection = bearish trend resumes
📈 Result Summary:
A confirmed breakout above $1.60 could open the door to $1.75+. Until then, this remains a high-risk bounce attempt. Traders should wait for volume-backed confirmation before committing.