

AMD – Choppy Structure May Confirm Full ABC Correction From $76
📉 Asset: AMD (Advanced Micro Devices)
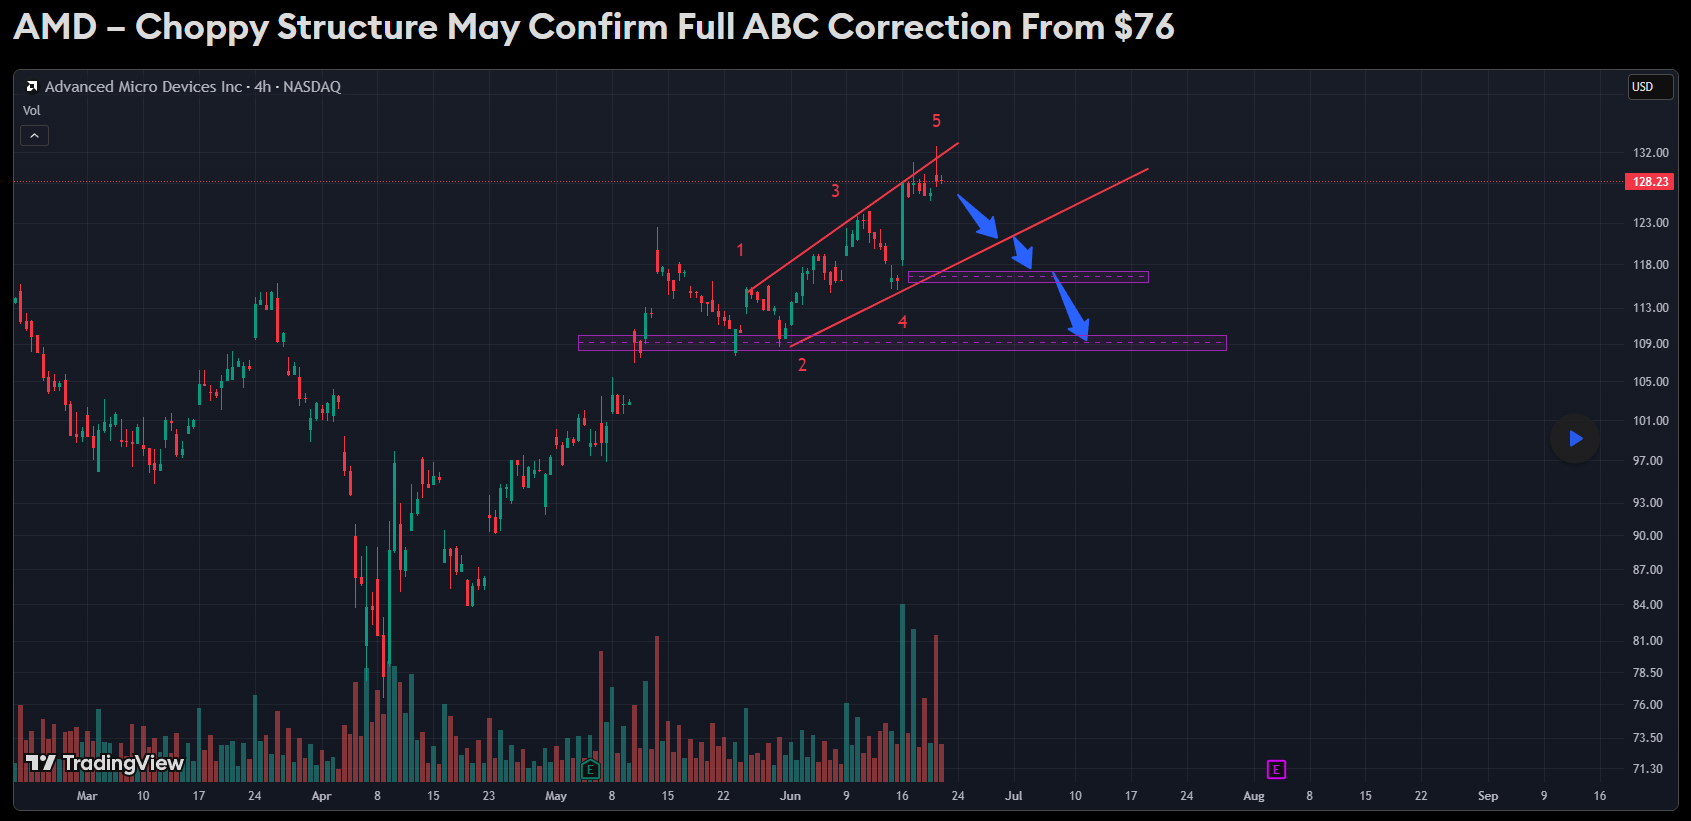
🎯 Directional Bias: Bearish Correction
✅ Target Zones: $116.00 and $110.00
📍 Current Price: $128.23
🕓 Timeframe: 4H
🔎
Click the image to view the full interactive chart on TradingView.
🧠 Technical Overview:
AMD initially surged from $115 to $130 on high volume, but the rally quickly lost momentum. Since May 20, price has shown a lack of direction and volume, evolving into a choppy and overlapping structure.
This raises the possibility that the full rise from $76 represents an ABC corrective pattern, not a motive wave. A break below $125 could confirm a diagonal failure and expose the stock to further downside toward $116 and $110 support levels.
📈 Conclusion:
If diagonal support is lost, sellers may accelerate. The pattern remains valid as long as price respects current resistance and breaks decisively downward. This analysis is based strictly on Elliott Wave principles — no indicators applied.